Key points
– Shares have made it to record highs this year but after strong gains are a bit vulnerable to a near term pull back.
– However, we remain upbeat on a 12-month view as falling inflation allows rate cuts and hopefully recession is avoided.
– Seven key charts worth keeping an eye on are: global business conditions PMIs; inflation; unemployment and underemployment; inflation expectations; earnings revisions; the gap between earnings yields and bond yields; and the US dollar. So far, most look ok.
Introduction
Share markets have pushed up to record highs this year, but can it continue? For some time now we have been monitoring seven key charts that are critical for the investment outlook. This note provides an update.
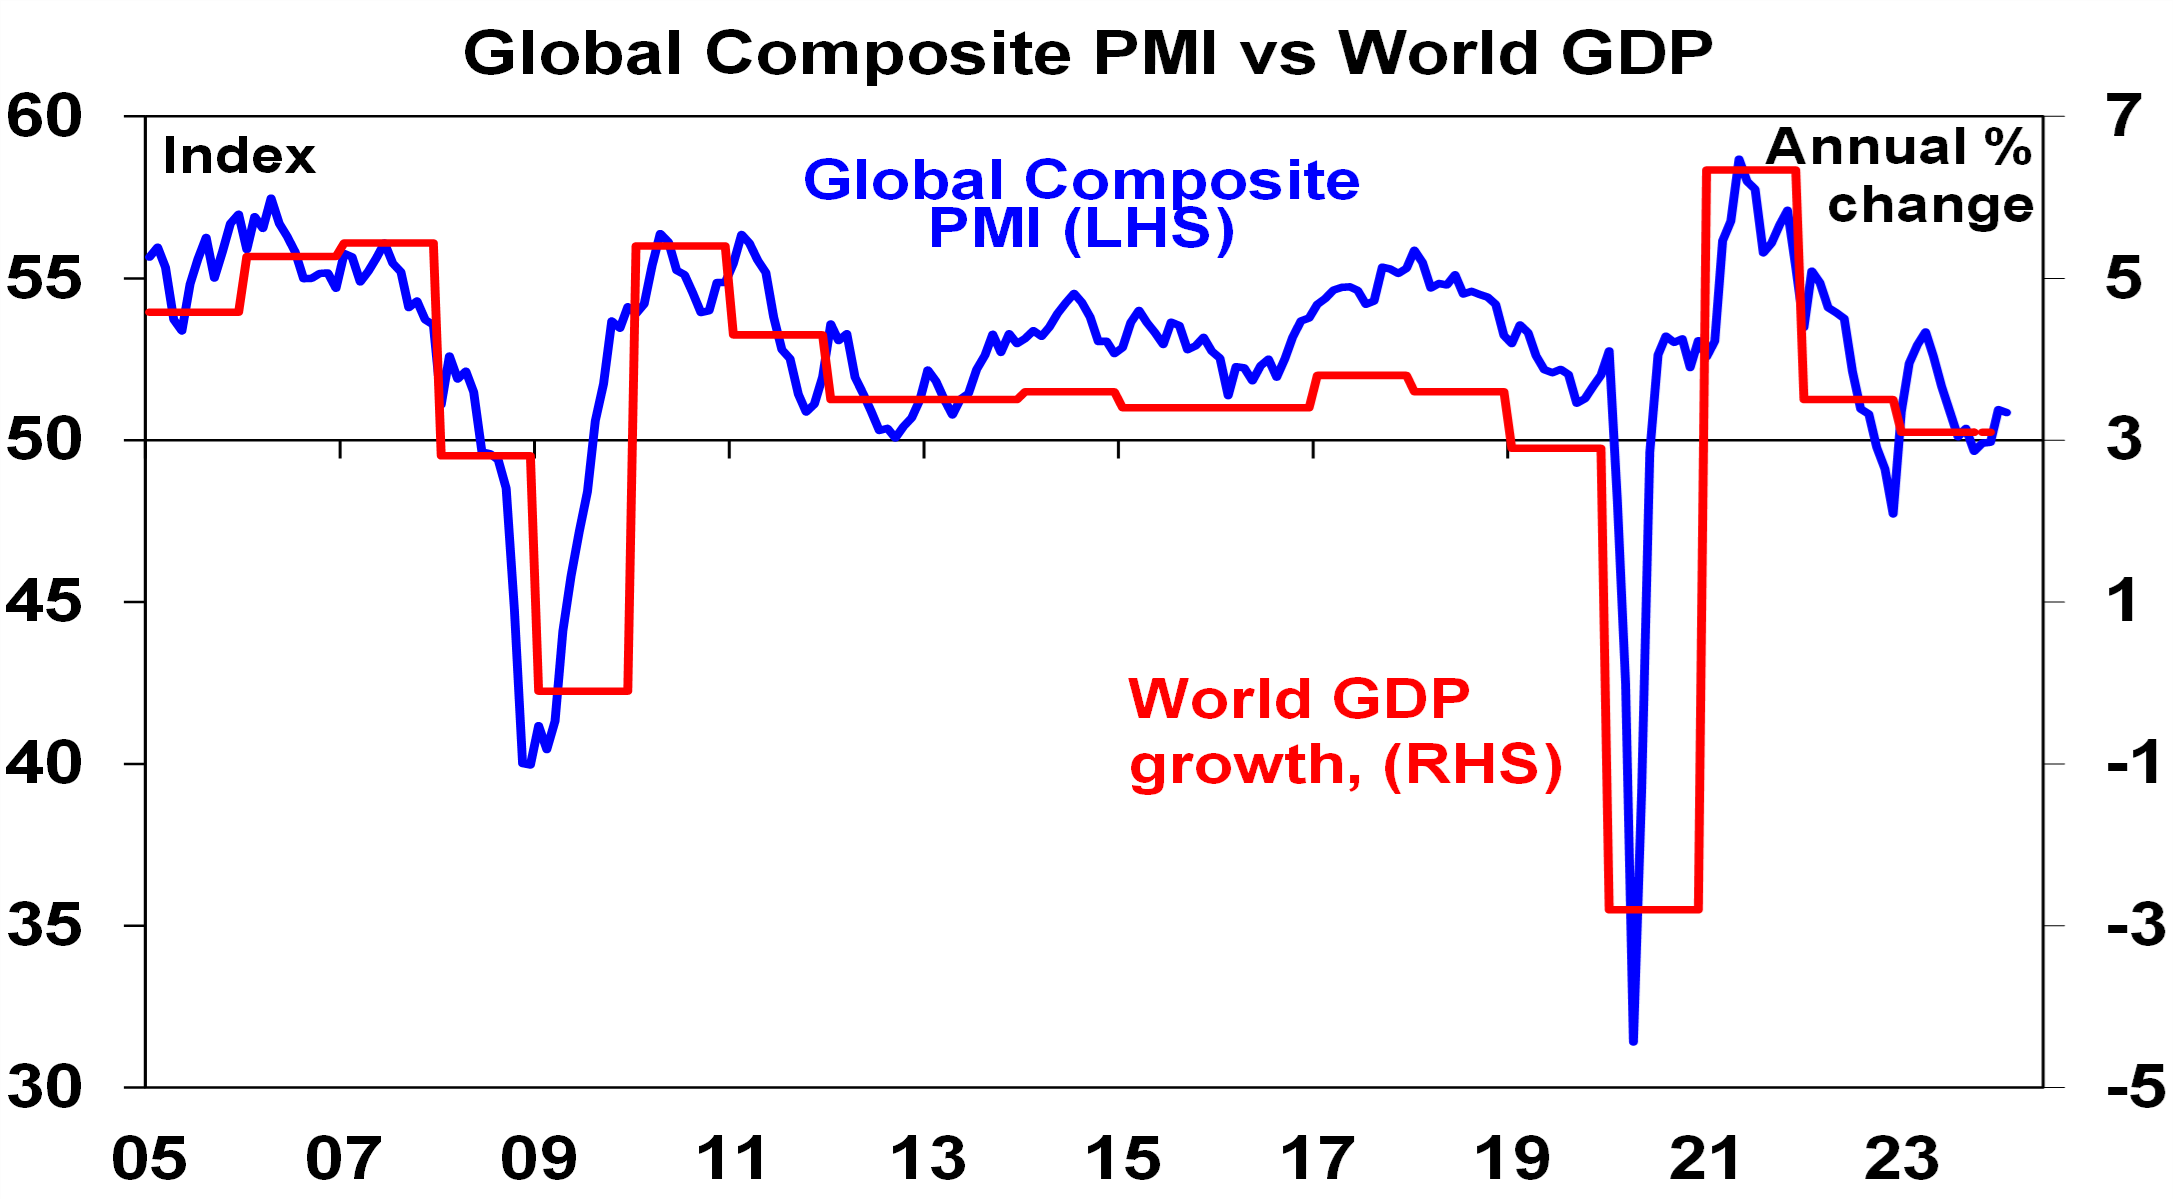
Chart 1 – global business conditions PMIs
A big driver of how shares perform this year will be whether major economies including Australia slide into recession and, if so, how deep that is. While it’s not our base case we would concede that the risk of a mild recession is still high given the big monetary tightening since 2022 and it’s noteworthy that the UK and Japan have already fallen into a technical recession with Europe stagnating. But even if the US and Australia slide into recession too at least a deep recession should be avoided as we have not seen the sort of spending excesses that often precede deep recessions. Global business conditions indexes (PMIs) – which are surveys of purchasing managers at businesses – will be a key warning indicator.
Source: Bloomberg, AMP
Right now they are soft but at levels consistent with okay growth.
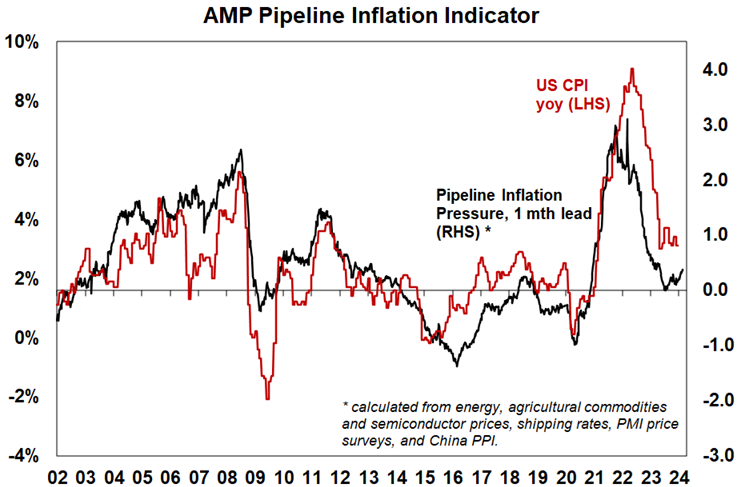
Chart 2 (and 2b) – inflation
A lot depends on what central banks do with interest rates and inflation is still the key here. While the ride has been bumpy lately and will likely remain so, the good news is that inflation in major countries is well down from its highs of 8 to 11% and now around 3 to 4%. So central banks are likely at the top on interest rates with many (the Fed and ECB) starting to debate when to cut rates.
Our US Pipeline Inflation Indicator has picked up slightly this year partly reflecting higher global shipping costs but these appear to be stabilising and the Indicator appears to reflect normal volatility around the 2% Fed target level and so it’s still consistent with lower US inflation. Services inflation remains sticky but is likely to slow reflecting cooling wages growth and rising productivity growth. We expect the Fed to start cutting rates in June.
Source: Bloomberg, AMP
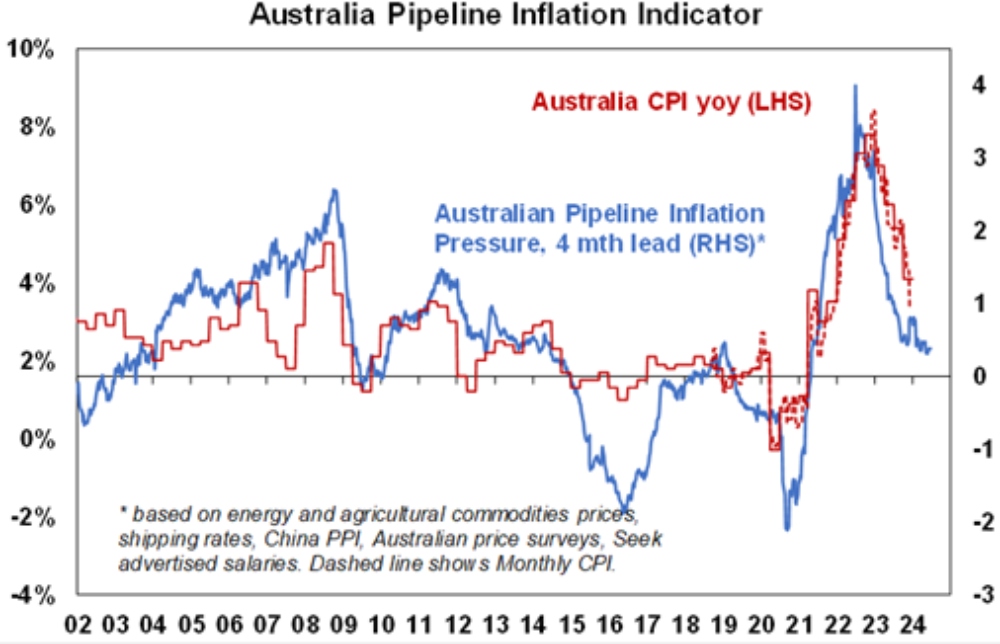
Australian inflation is lagging the US by 6 months, but our Australian Pipeline Inflation Indicator is continuing to trend down pointing to a further fall in inflation. While the RBA retains a mild tightening bias awaiting “sufficient confidence that inflation [will] return to target in a reasonable time frame” our assessment is that the cash rate has peaked and that the RBA will start cutting from around mid-year.
Source: Bloomberg, AMP
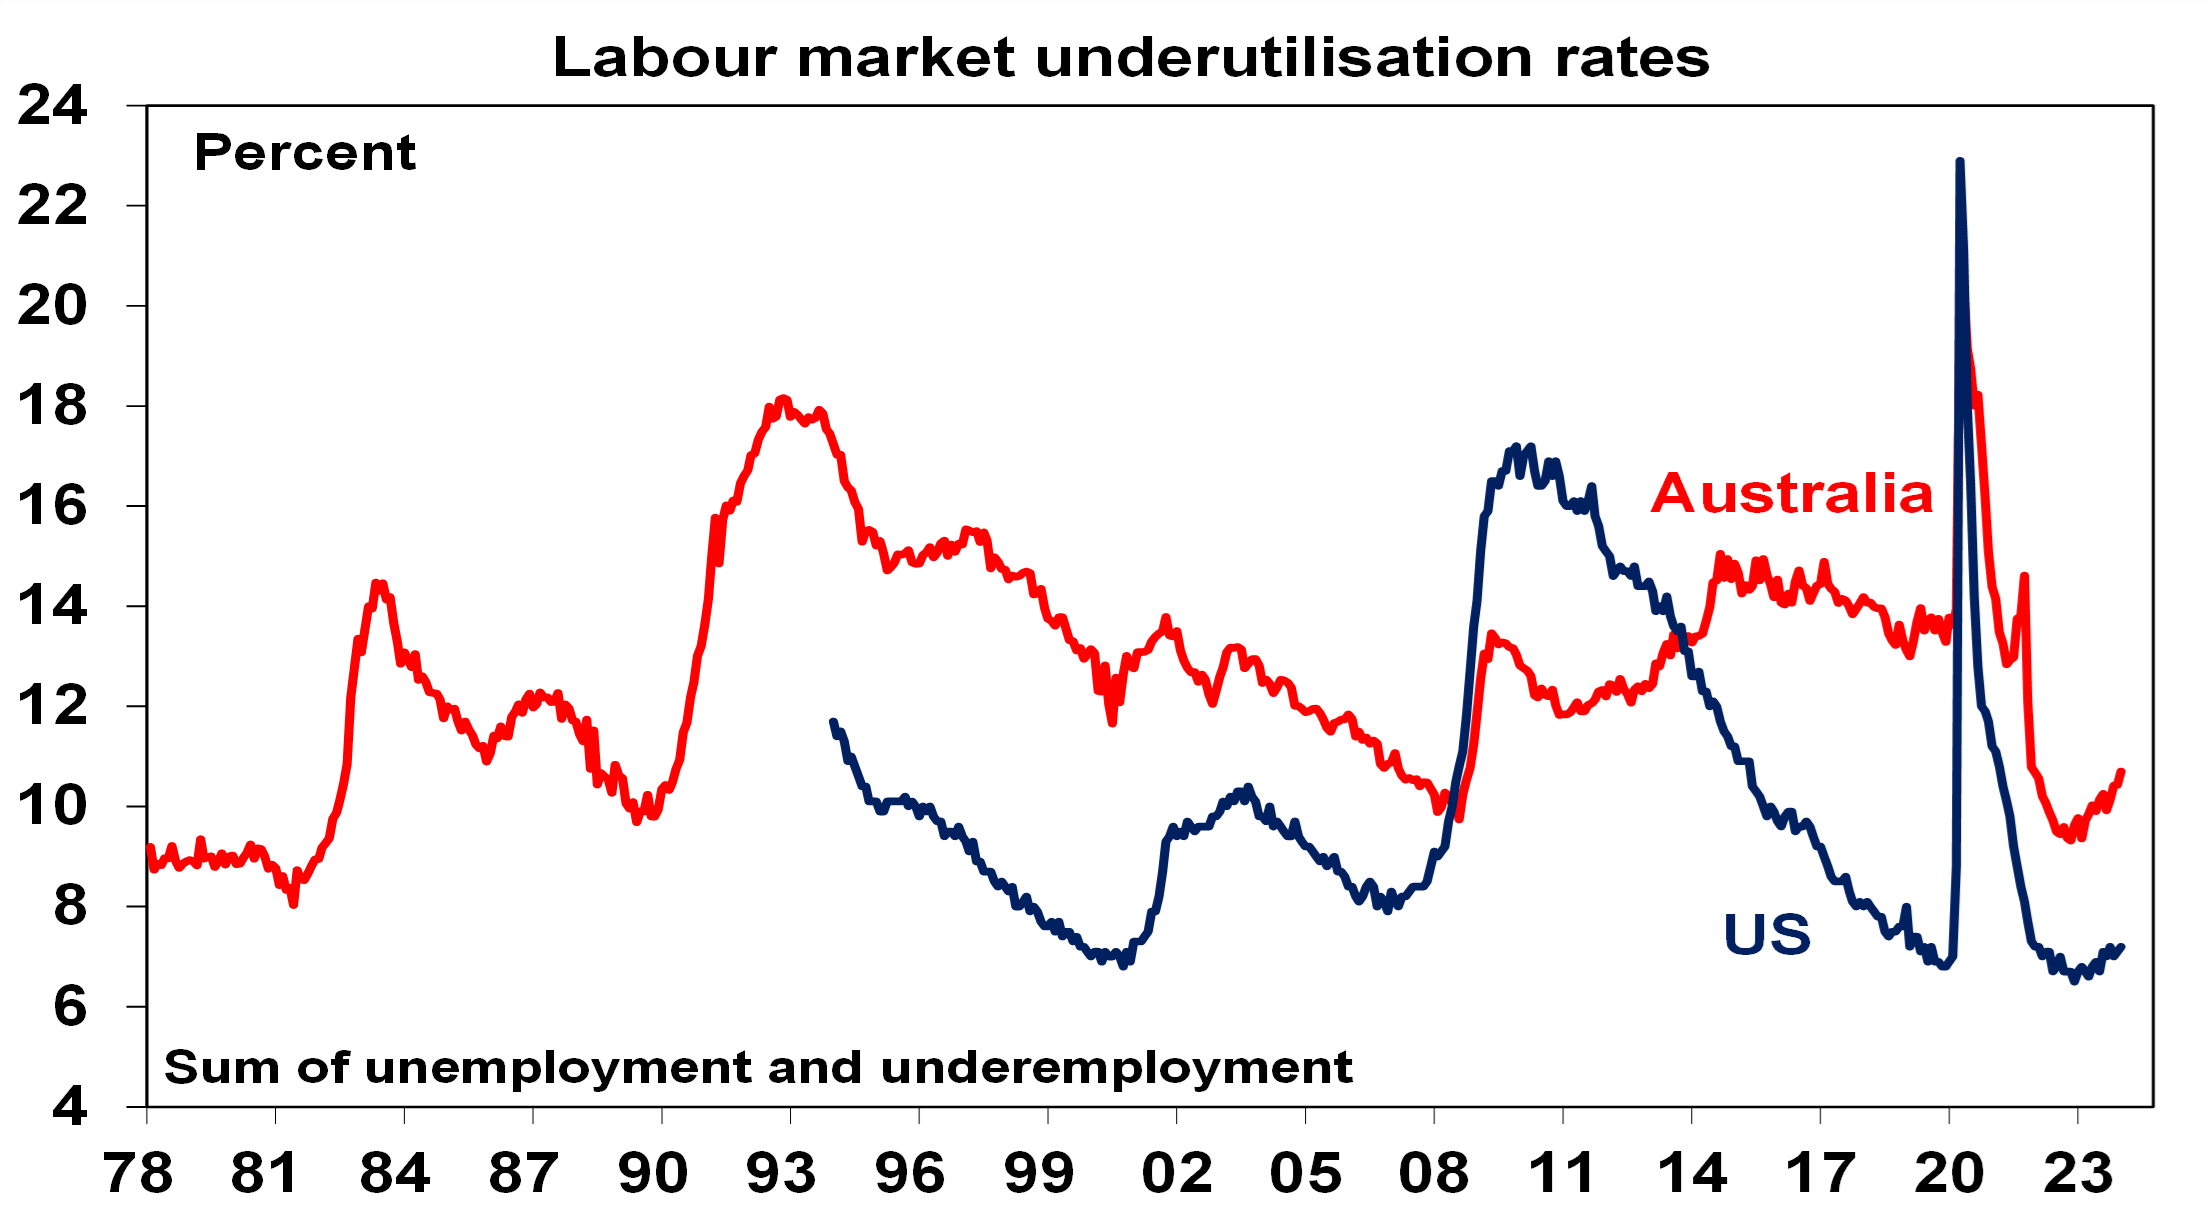
Chart 3 – unemployment and underemployment
Labour market tightness remains critical as it determines wages growth which is the biggest component in most business costs. Tight labour market conditions post the pandemic have seen wages growth pick up and this is now the main driver of sticky service sector inflation. The risk is that high wages growth locks in high inflation making it harder to get inflation back down without a deep recession. However, while labour markets remain tight – evident in still low unemployment – they appear to be cooling with falling job openings and hiring plans and a gradual rising trend in unemployment and underemployment now evident in both the US and Australia. As a result, wages growth looks to have passed the peak in the US, Europe and UK and is likely at the peak in Australia. However, central banks including the RBA would like to see more evidence that this is the case and so labour market underutilisation will be watched closely.
Source: Bloomberg, AMP
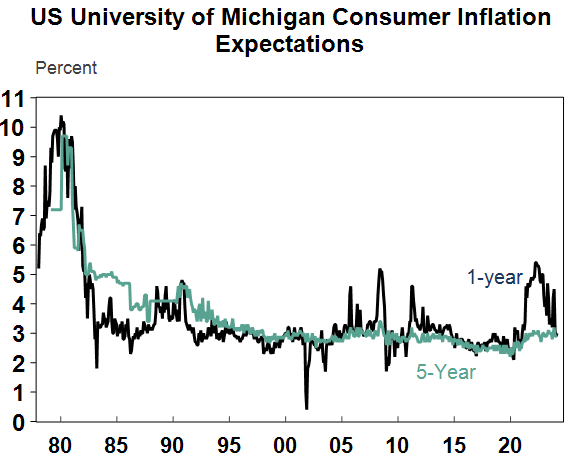
Chart 4 – longer term inflation expectations
The 1970s tells us the longer inflation stays high, the more businesses, workers and consumers expect it to stay high and then they behave in ways which perpetuate it – in terms of wage claims, price setting and tolerance for price rises. The good news is that short term inflation expectations have fallen sharply, and longer-term inflation expectations remain low. This is very different from 1980 when US inflation expectations were around 10% and deep recession was required to get inflation back down.
Source: Macrobond, AMP
Chart 5 – earnings revisions
Consensus US and global earnings growth expectations for this year are running around 8%, whereas Australia is expected to see a 5% or so fall in earnings this financial year.
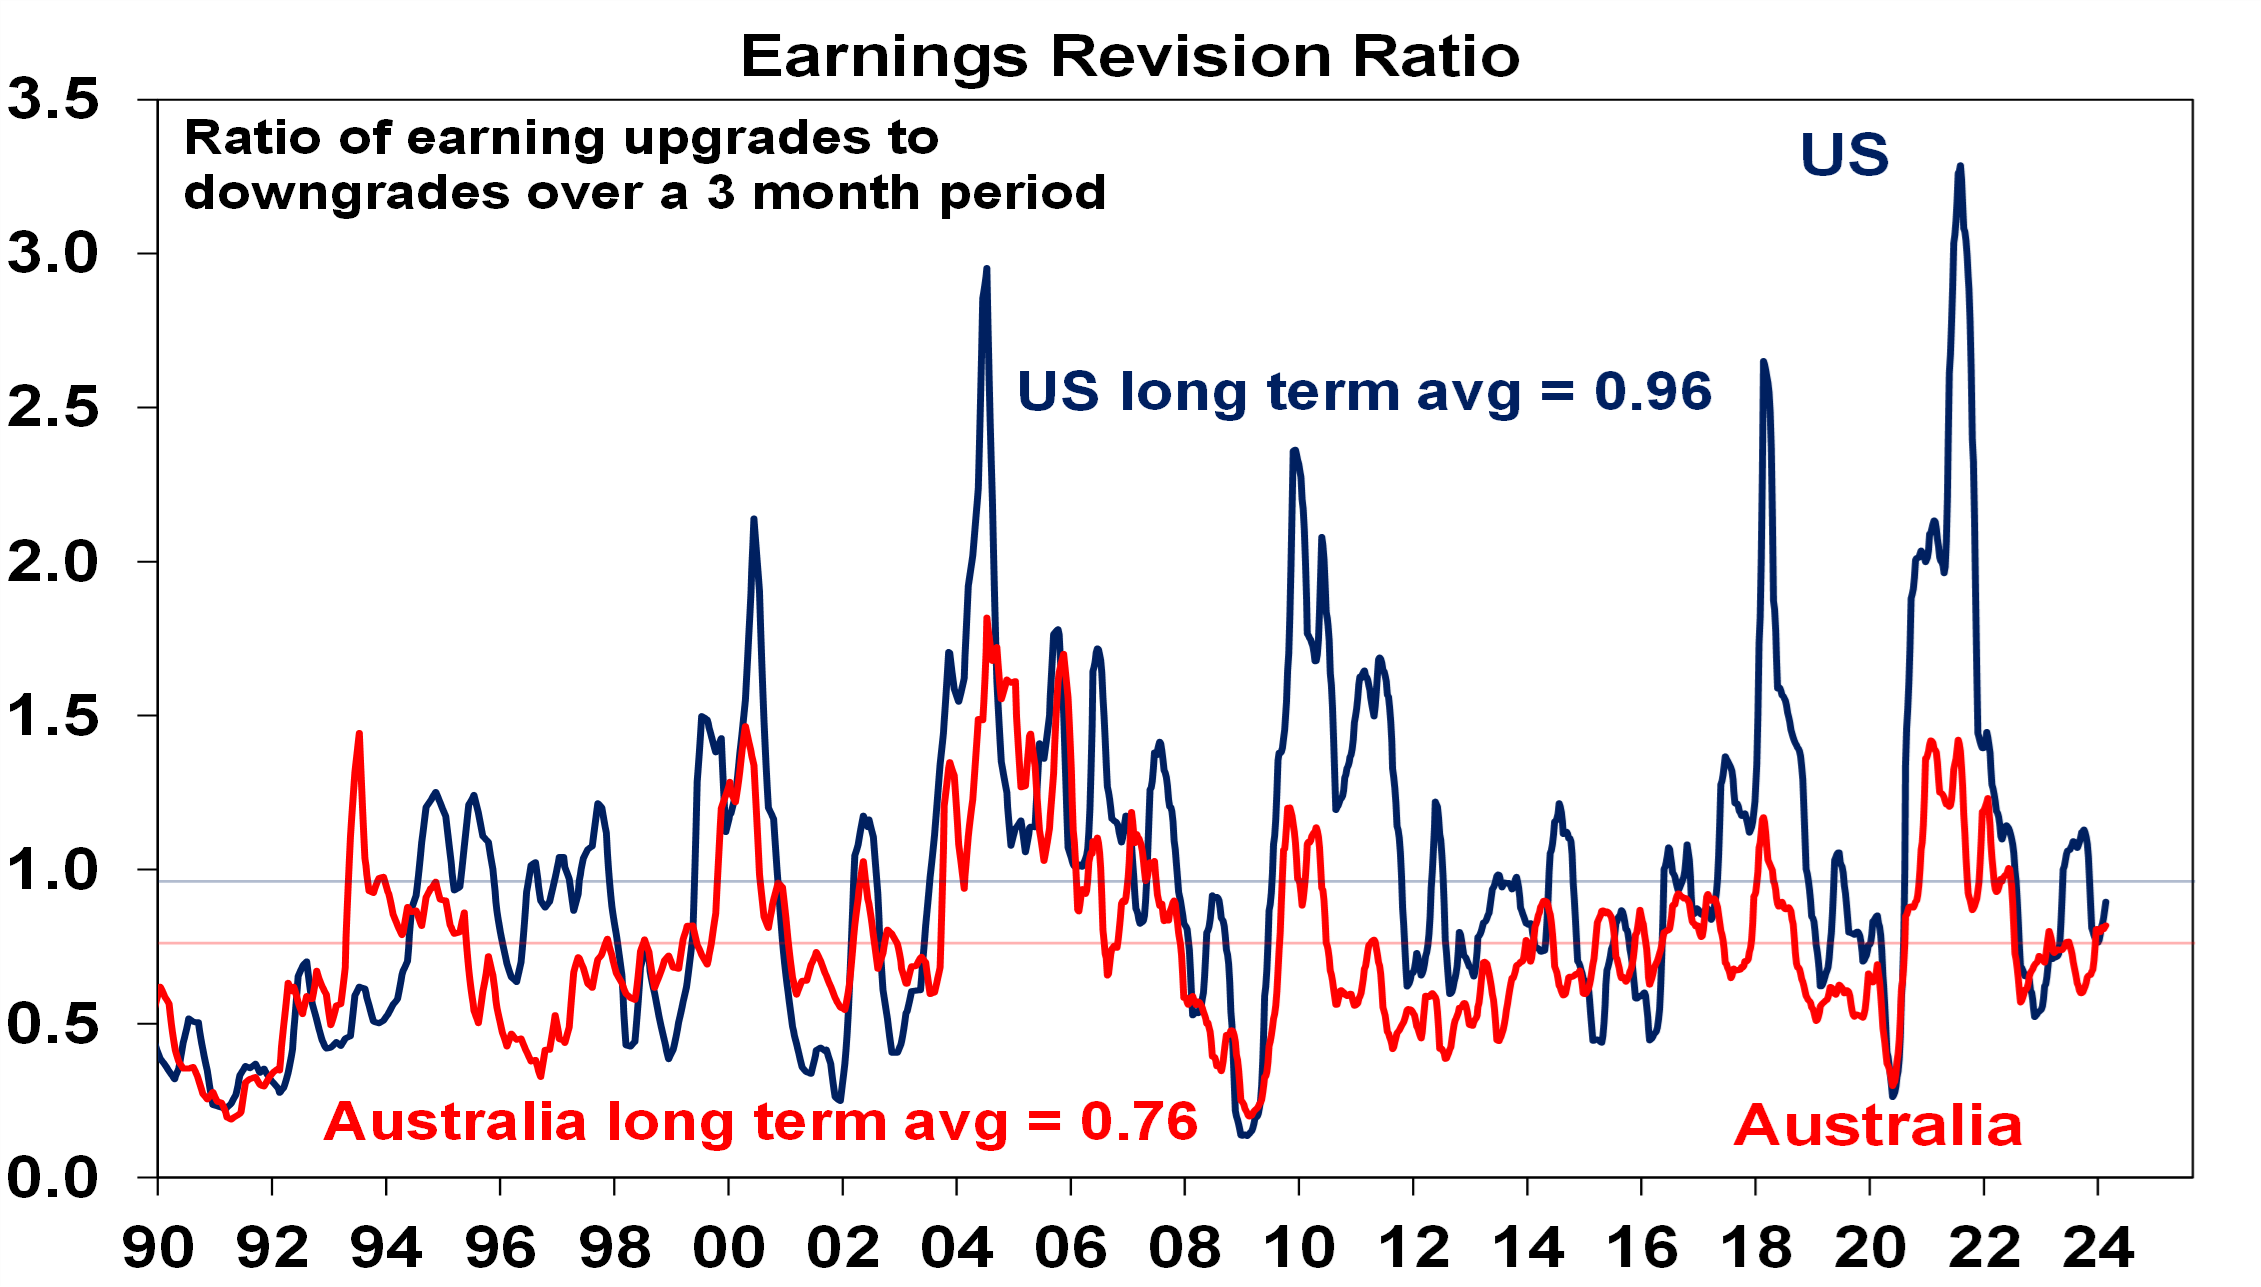
Source: Reuters, AMP
The main risk is a recession resulting in an earnings slump like those seen in the early 1990s, 2001-03 in the US and 2008 but recently revisions to earnings expectations have been around average.
Chart 6 – the gap between earnings and bond yields
Since 2020, rising bond yields weighed on share market valuations. As a result, the gap between earnings yields and bond yields (which is a proxy for shares’ risk premium) has narrowed to its lowest since the GFC in the US and Australia. Compared to the pre-GFC period shares still look cheap relative to bonds, but this is not the case compared to the post GFC period suggesting valuations may be a bit of a constraint to share market gains given uncertainties around interest rates, economic and earnings growth and various geopolitical issues. Australian share valuations look a bit more attractive than those in the US though helped by a higher earnings yield (or lower PEs). Ideally bond yields need to decline.
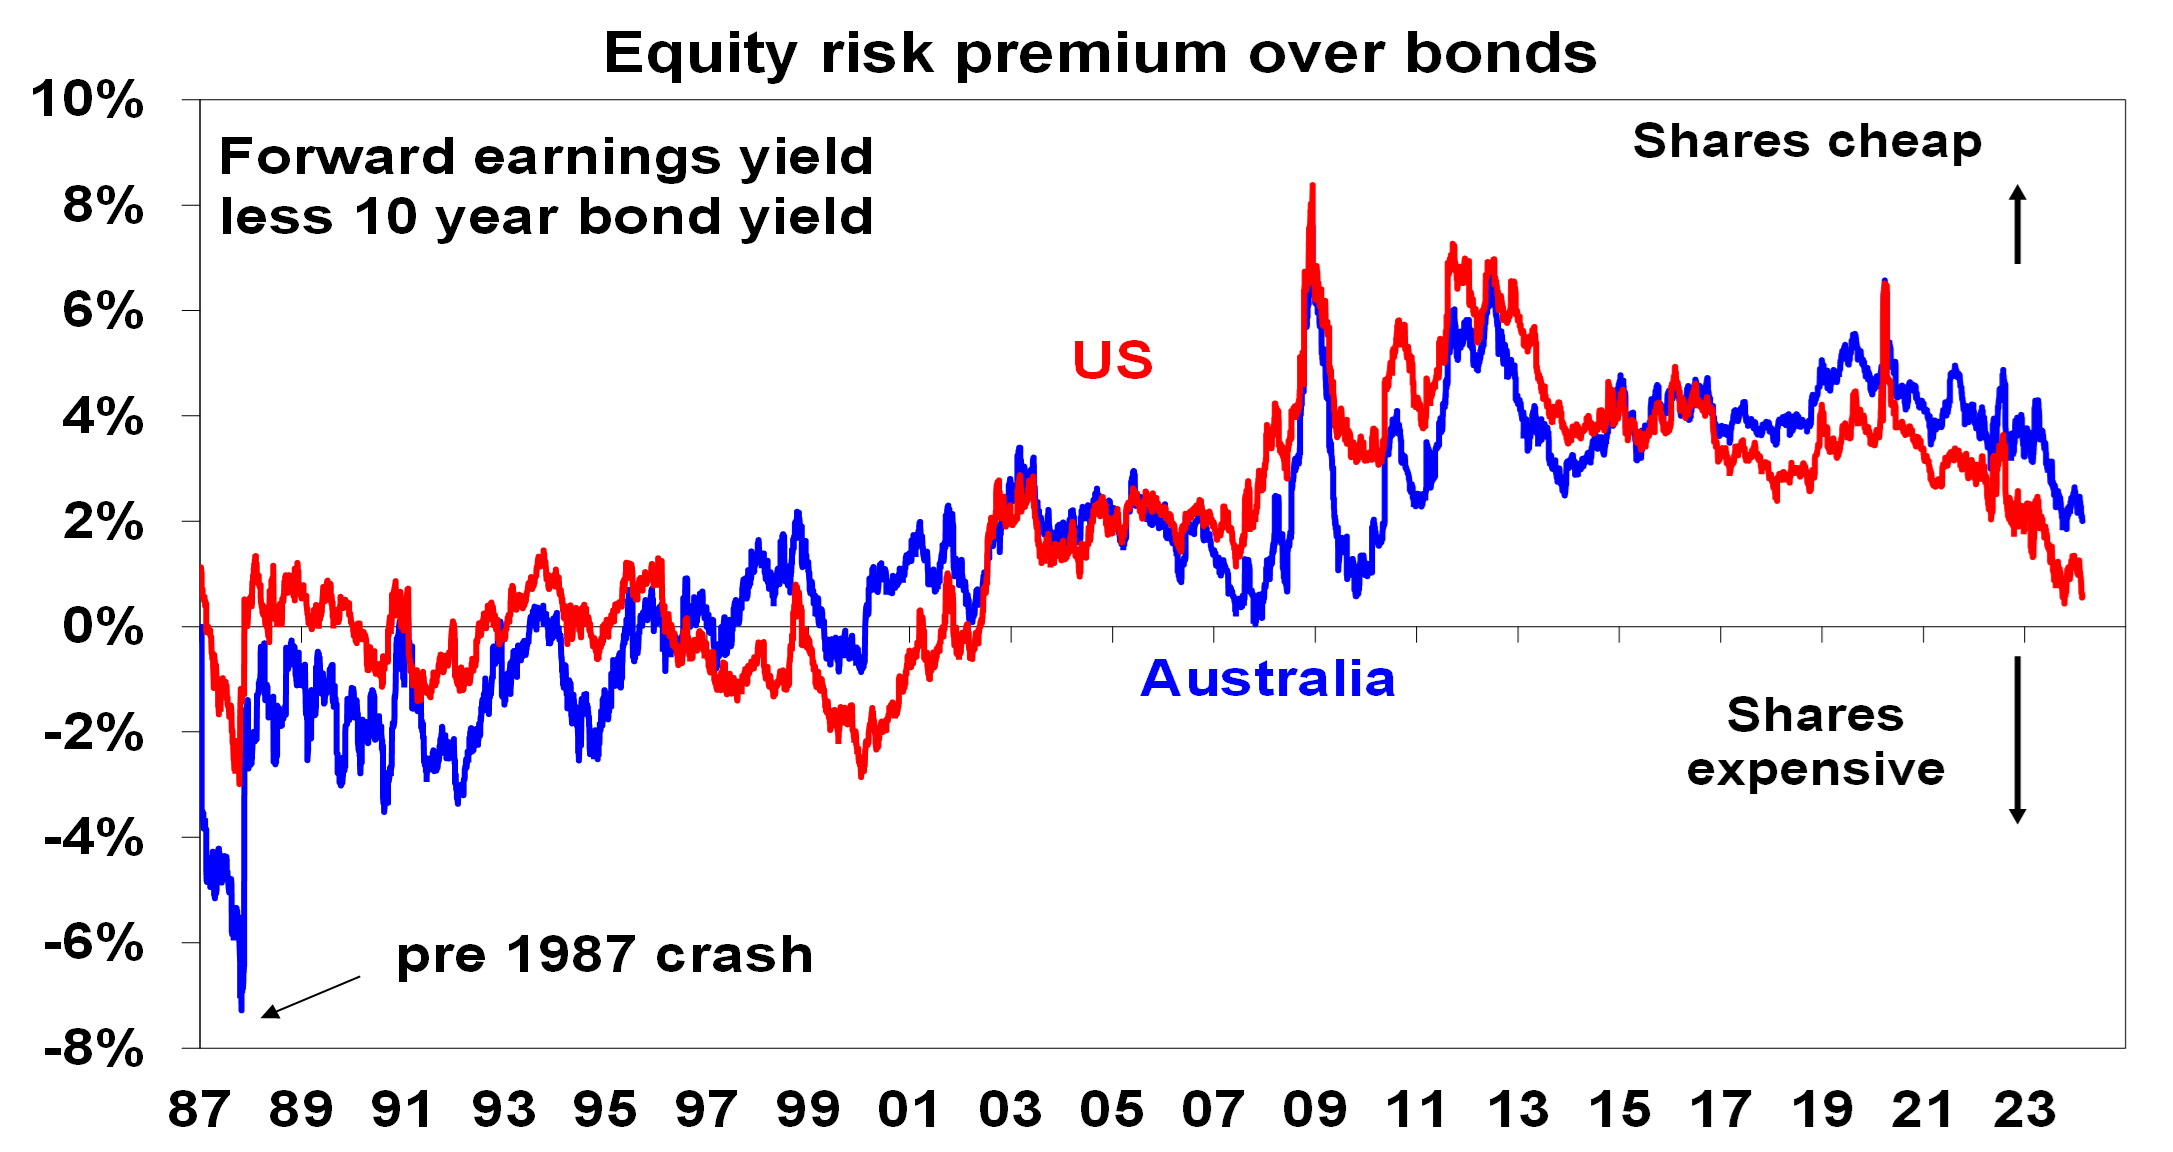
Source: Reuters, AMP
Chart 7 – the US dollar
Due to the relatively low exposure of the US economy to cyclical sectors (like manufacturing) and the high use of US dollar denominated debt, the $US is a “risk-off” currency. It tends to go up when there are worries about global growth and down when the outlook brightens. An increasing $US is also bad news for those with $US denominated debt in the emerging world. So, moves in it bear close watching as a key bellwether of the investment cycle. 2022 saw a surge in the $US with safe haven demand in the face of worries about recession, war and aggressive Fed tightening. Since its high it has fallen back which is a positive sign – but the decline has stalled over the last year suggesting a degree of caution. A further downtrend in the $US would be a positive sign for investment markets this year, whereas a sustained new upswing would suggest they may be vulnerable. So far though it looks stuck, which also partly explains the softness in the $A which is a cyclical currency.
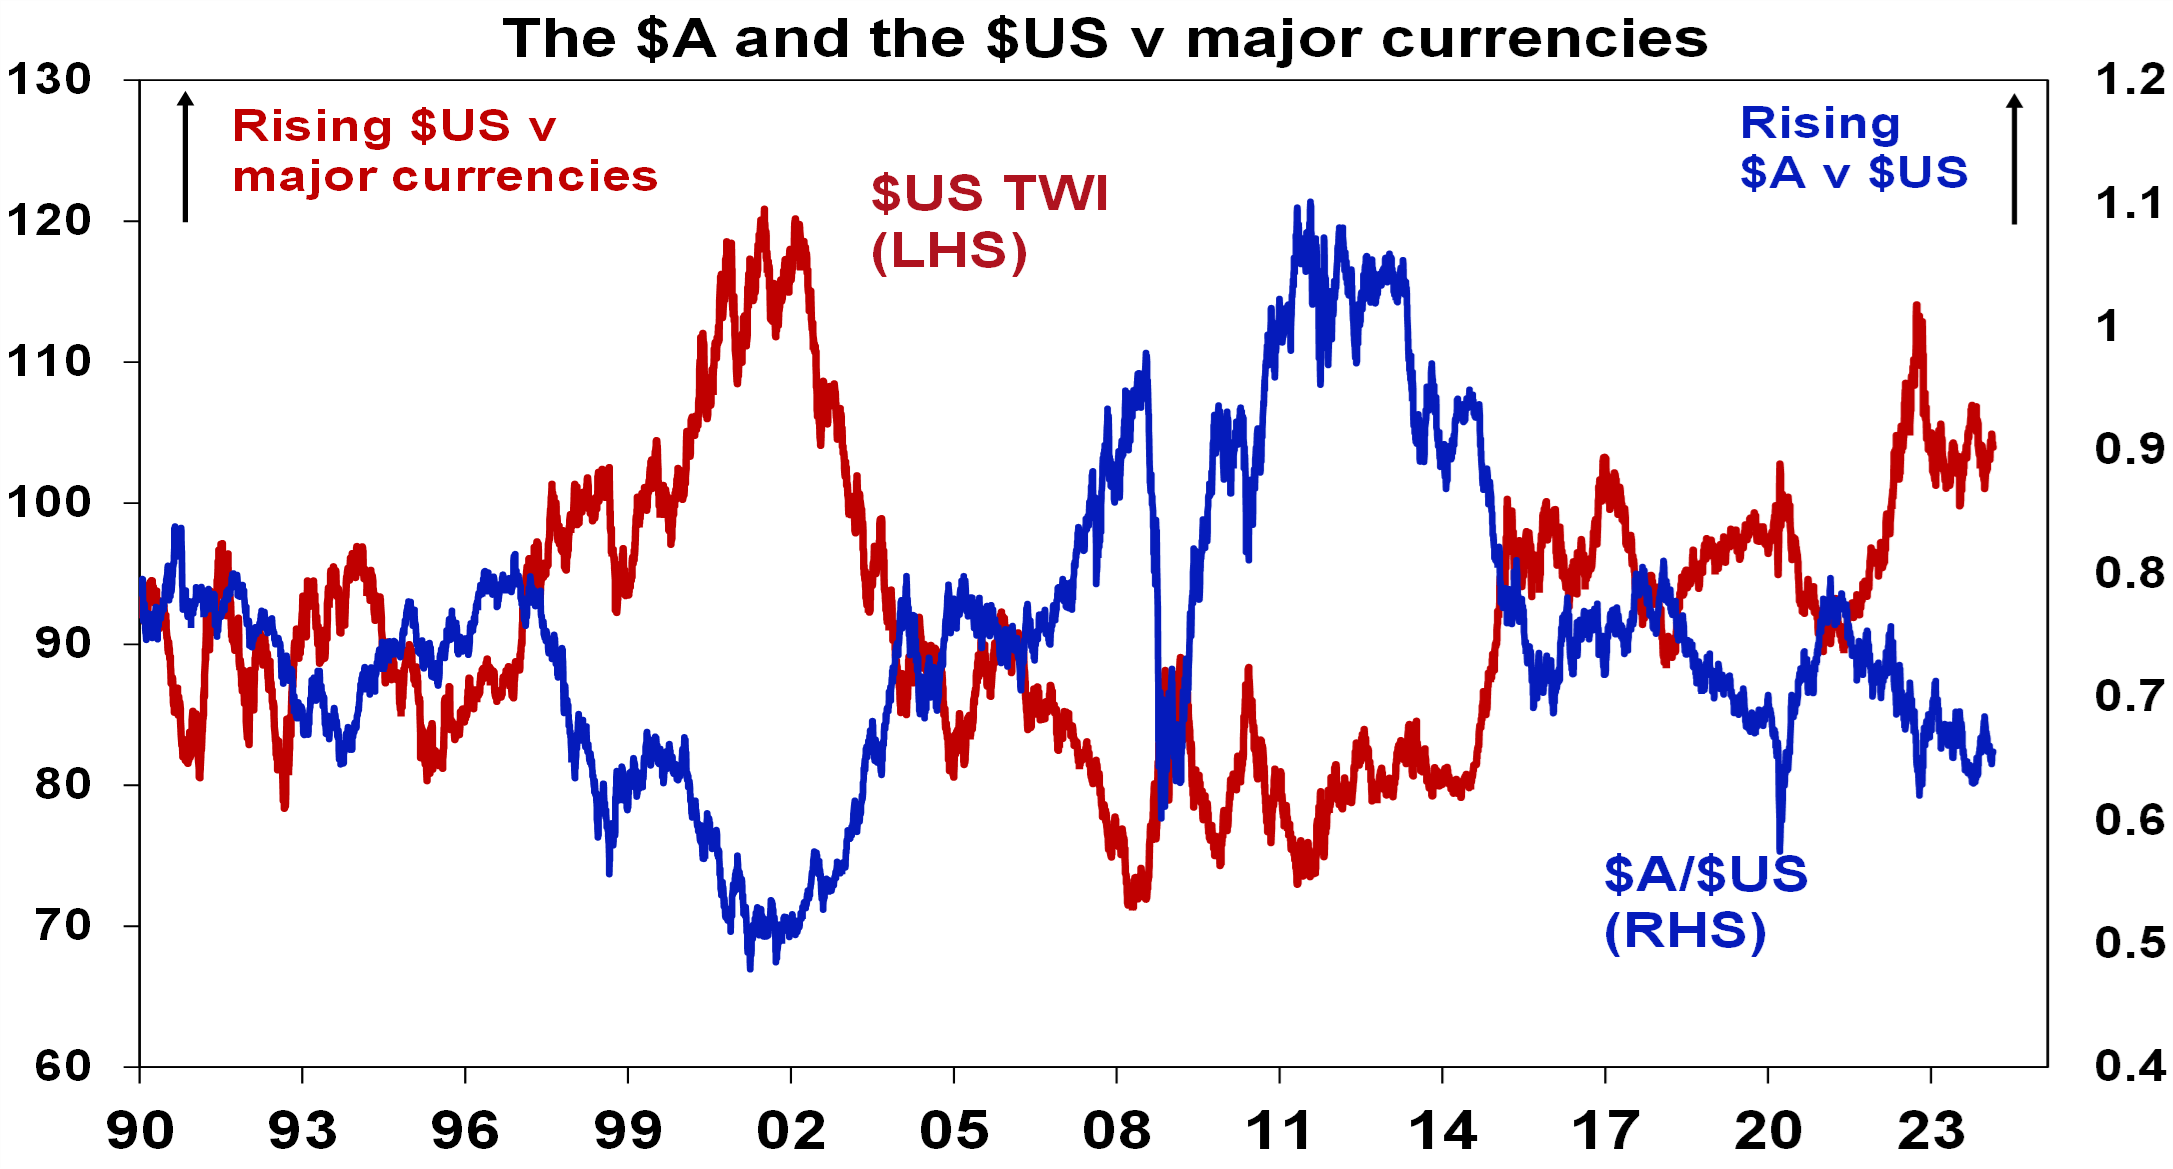
Source: Bloomberg, AMP
What you need to know
While every care has been taken in the preparation of this article, neither National Mutual Funds Management Ltd (ABN 32 006 787 720, AFSL 234652) (NMFM), AMP Limited ABN 49 079 354 519 nor any other member of the AMP Group (AMP) makes any representations or warranties as to the accuracy or completeness of any statement in it including, without limitation, any forecasts. Past performance is not a reliable indicator of future performance. This document has been prepared for the purpose of providing general information, without taking account of any particular investor’s objectives, financial situation or needs. An investor should, before making any investment decisions, consider the appropriateness of the information in this document, and seek professional advice, having regard to the investor’s objectives, financial situation and needs. This article is solely for the use of the party to whom it is provided and must not be provided to any other person or entity without the express written consent AMP. This article is not intended for distribution or use in any jurisdiction where it would be contrary to applicable laws, regulations or directives and does not constitute a recommendation, offer, solicitation or invitation to invest.